Note
Go to the end to download the full example code or to run this example in your browser via Binder
EDA
EDA plots using the BikeSharing dataset as example.
Experiment initialization and data preparation
from piml import Experiment

exp = Experiment()
exp.data_loader(data="BikeSharing", silent=True)
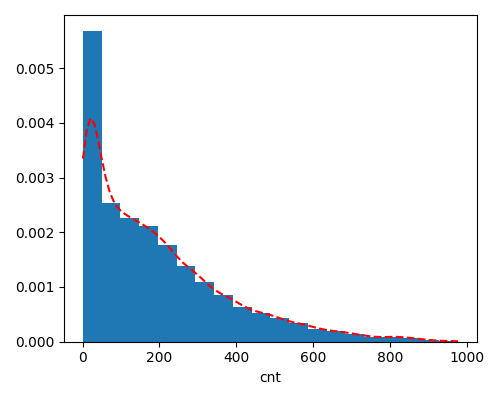
histogram-density plot
exp.eda(show='univariate', uni_feature='cnt', figsize=(5, 4))
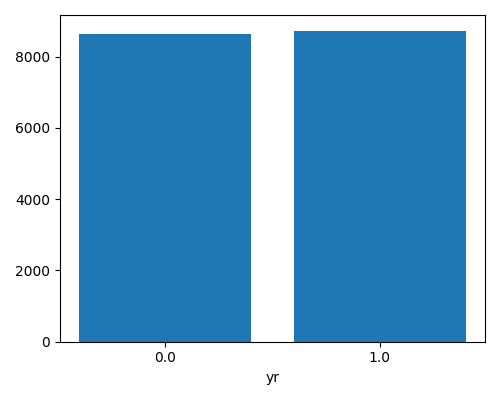
bar plot
exp.eda(show='univariate', uni_feature='yr', figsize=(5, 4))
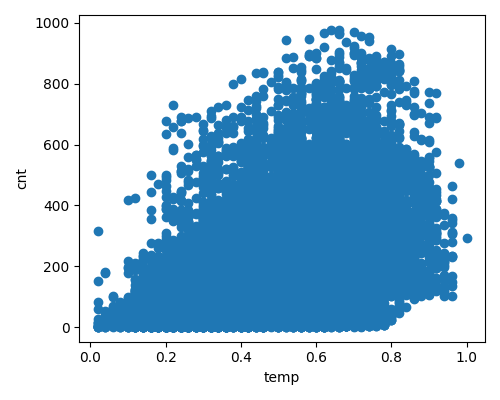
scatter plot
exp.eda(show='bivariate', bi_features=['temp', 'cnt'], figsize=(5, 4))
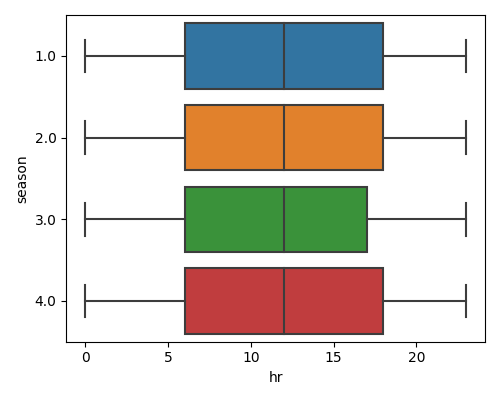
box plot
exp.eda(show='bivariate', bi_features=['hr', 'season'], figsize=(5, 4))
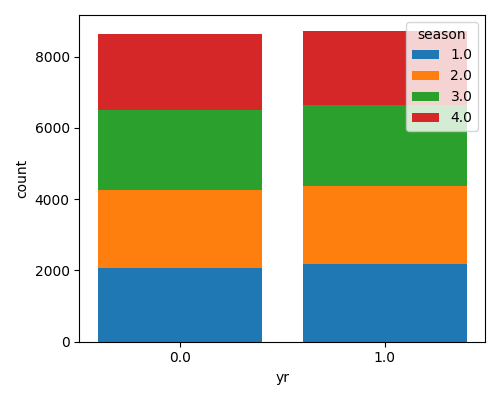
stack bar plot
exp.eda(show='bivariate', bi_features=['yr', 'season'], figsize=(5, 4))
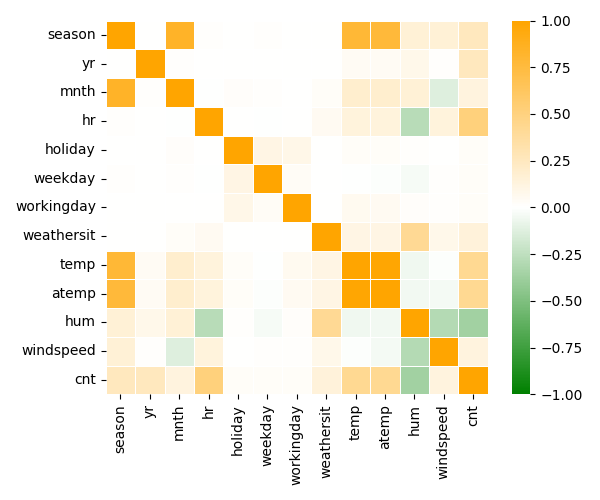
correlation heatmap
exp.eda(show='multivariate', multi_type='correlation_heatmap', figsize=(6, 5))
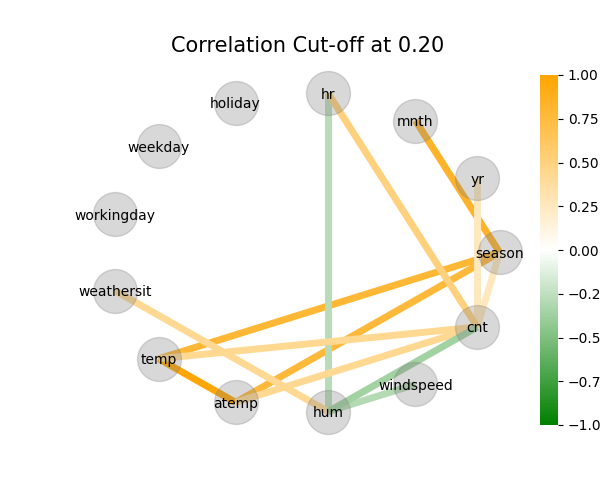
correlation graph
exp.eda(show='multivariate', multi_type='correlation_graph', figsize=(6, 5))
Total running time of the script: ( 0 minutes 55.352 seconds)
Estimated memory usage: 24 MB