Note
Go to the end to download the full example code or to run this example in your browser via Binder
XGB-2 Regression (Bike Sharing)
Experiment initialization and data preparation
from piml import Experiment
from piml.models import XGB2Regressor

exp = Experiment()
exp.data_loader(data="BikeSharing", silent=True)
exp.data_summary(feature_exclude=["yr", "mnth", "temp"], silent=True)
exp.data_prepare(target="cnt", task_type="regression", silent=True)
Train Model
exp.model_train(model=XGB2Regressor(), name="XGB2")
Evaluate predictive performance
exp.model_diagnose(model="XGB2", show="accuracy_table")
          MSE     MAE       R2

Train  0.0090  0.0669   0.7382
Test   0.0095  0.0688   0.7287
Gap    0.0005  0.0019  -0.0095
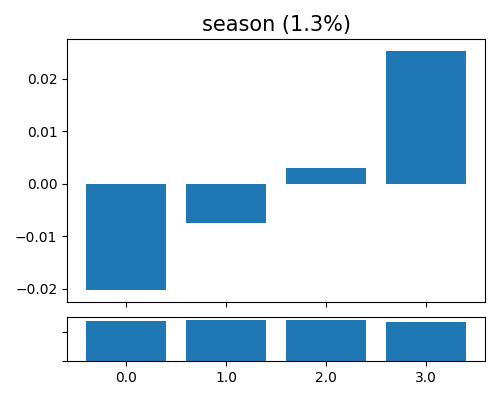
Global effect plot for season
exp.model_interpret(model="XGB2", show="global_effect_plot", uni_feature="season", figsize=(5, 4))
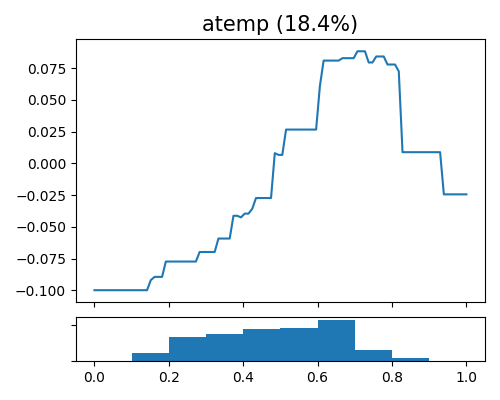
Global effect plot for hr
exp.model_interpret(model="XGB2", show="global_effect_plot", uni_feature="atemp", original_scale=True, figsize=(5, 4))
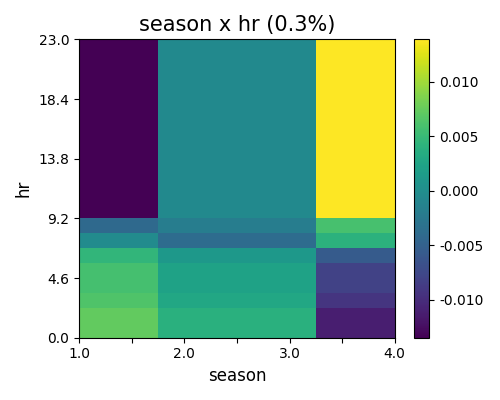
Global effect plot for hr and season
exp.model_interpret(model="XGB2", show="global_effect_plot", bi_features=["hr", "season"],
                    sliced_line=False, original_scale=True, figsize=(5, 4))
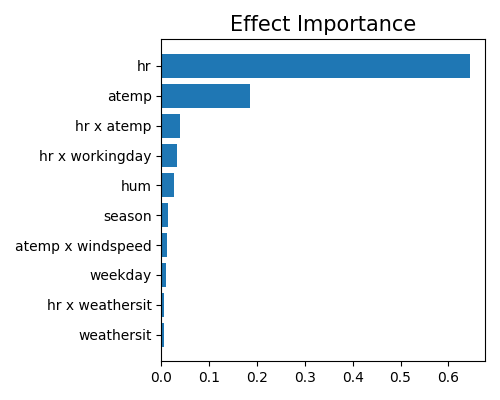
Effect importance
exp.model_interpret(model="XGB2", show="global_ei", figsize=(5, 4))
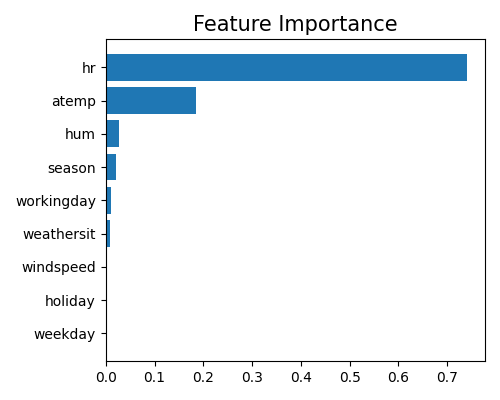
Feature importance
exp.model_interpret(model="XGB2", show="global_fi", figsize=(5, 4))
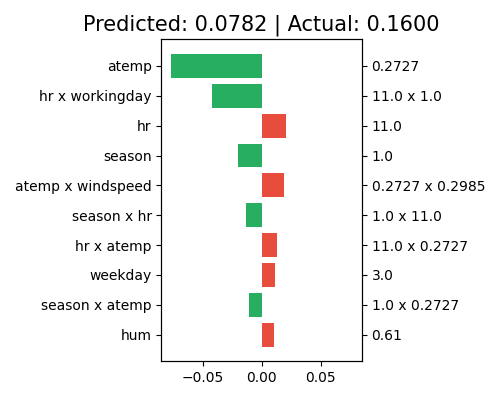
Local interpretation by effect
exp.model_interpret(model="XGB2", show="local_ei", sample_id=0, original_scale=True, figsize=(5, 4))
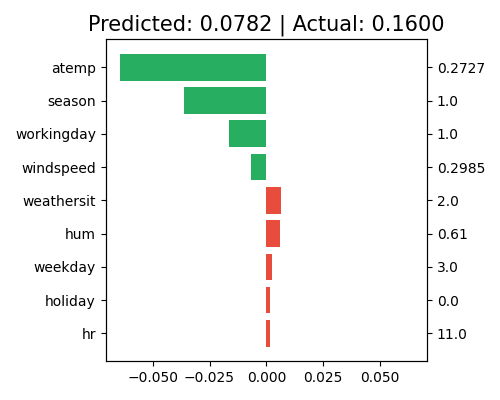
Local interpretation by feature
exp.model_interpret(model="XGB2", show="local_fi", sample_id=0, original_scale=True, figsize=(5, 4))
Total running time of the script: ( 1 minutes 31.947 seconds)
Estimated memory usage: 31 MB