Note
Go to the end to download the full example code or to run this example in your browser via Binder
Model Comparison: Regression
Experiment initialization and data preparation
from piml import Experiment
from piml.models import GLMRegressor
from xgboost import XGBRegressor

exp = Experiment()
exp.data_loader(data="BikeSharing", silent=True)
exp.data_summary(feature_exclude=["yr", "mnth", "temp"], silent=True)
exp.data_prepare(target="cnt", task_type="regression", silent=True)
Train Model
exp.model_train(GLMRegressor(), name="GLM")
exp.model_train(XGBRegressor(max_depth=2), name="XGB2")
exp.model_train(XGBRegressor(max_depth=7), name="XGB7")
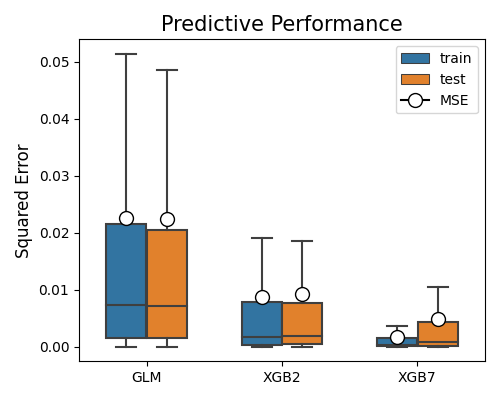
Accuracy comparison with MSE
exp.model_compare(models=["GLM", "XGB2", "XGB7"], show="accuracy_plot", metric="MSE", figsize=(5, 4))
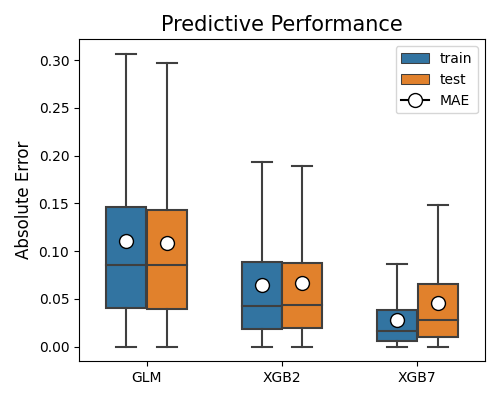
Accuracy comparison with MAE
exp.model_compare(models=["GLM", "XGB2", "XGB7"], show="accuracy_plot", metric="MAE", figsize=(5, 4))
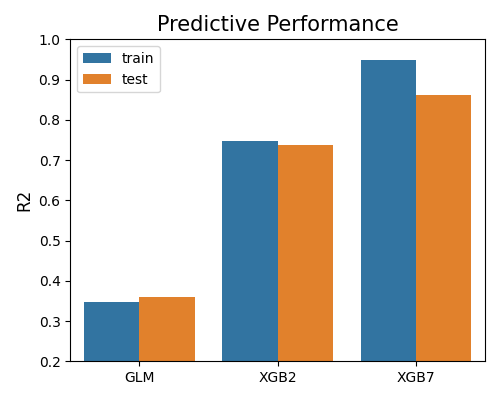
Accuracy comparison with R2
exp.model_compare(models=["GLM", "XGB2", "XGB7"], show="accuracy_plot", metric="R2", figsize=(5, 4))
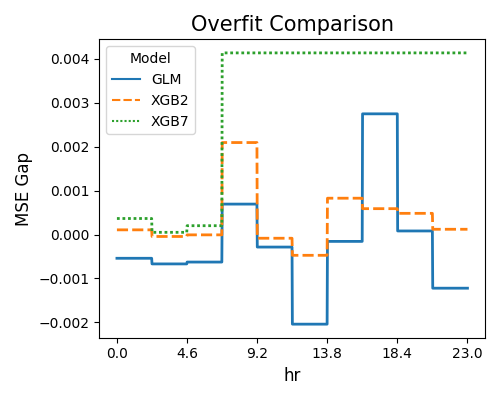
Overfit comparison with MSE metric
exp.model_compare(models=["GLM", "XGB2", "XGB7"], show="overfit",
                  slice_method="histogram", slice_feature="hr",
                  bins=10, metric="MSE", original_scale=True, figsize=(5, 4))
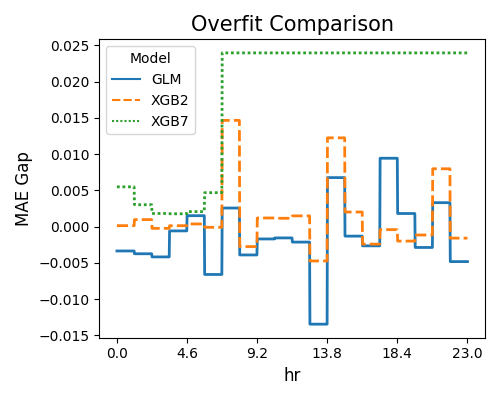
Overfit comparison with MAE metric
exp.model_compare(models=["GLM", "XGB2", "XGB7"], show="overfit",
                  slice_method="histogram", slice_feature="hr",
                  metric="MAE", original_scale=True, figsize=(5, 4))
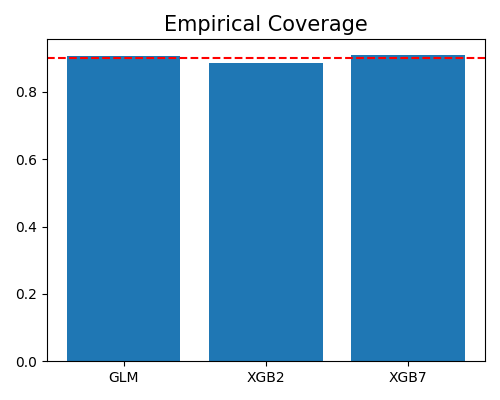
Reliability coverage comparison
exp.model_compare(models=["GLM", "XGB2", "XGB7"], show="reliability_coverage", alpha=0.1, figsize=(5, 4))
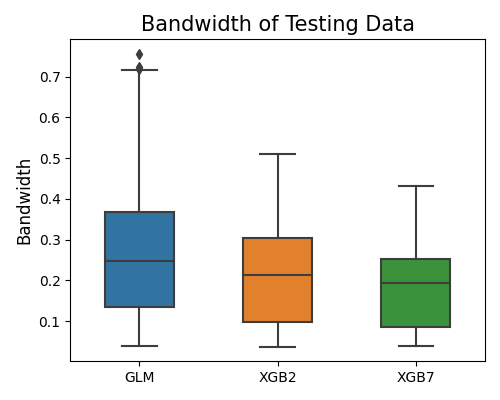
Reliability bandwidth comparison
exp.model_compare(models=["GLM", "XGB2", "XGB7"], show="reliability_bandwidth", alpha=0.1, figsize=(5, 4))
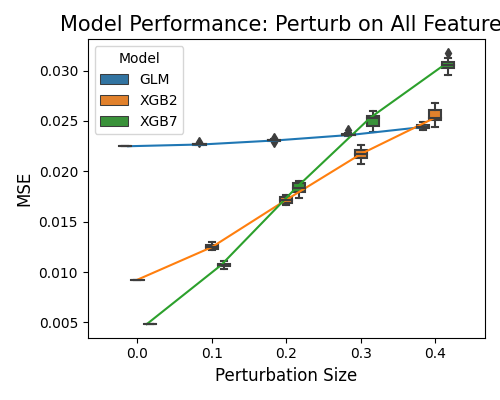
Robustness comparison with default settings
exp.model_compare(models=["GLM", "XGB2", "XGB7"], show="robustness_perf", figsize=(5, 4))
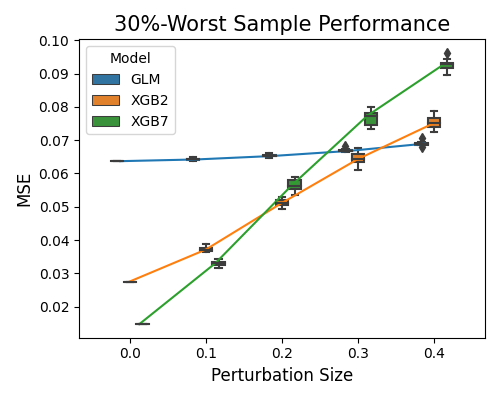
Robustness comparison on worst alpha-percent samples
exp.model_compare(models=["GLM", "XGB2", "XGB7"], show="robustness_perf_worst", alpha=0.3, figsize=(5, 4))
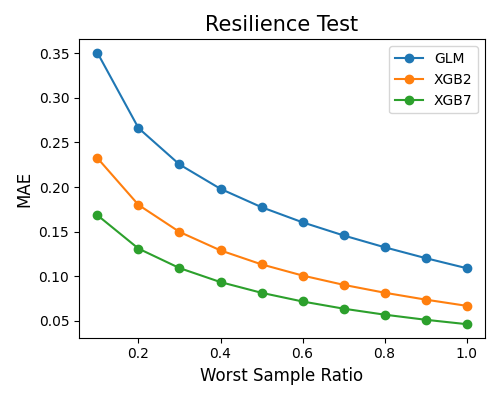
Resilience comparison with worst-sample scenario
exp.model_compare(models=["GLM", "XGB2", "XGB7"], show="resilience_perf",
                  resilience_method="worst-sample", immu_feature=None, metric="MAE", figsize=(5, 4))
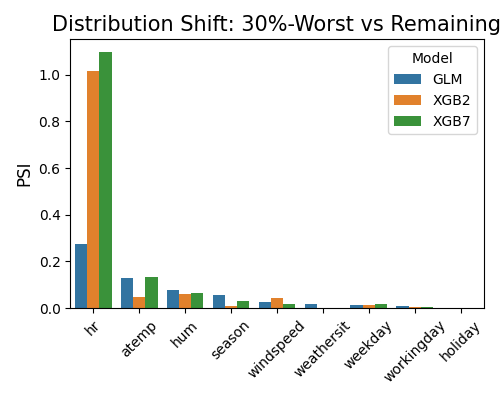
Resilience distance comparison with worst-sample scenario
exp.model_compare(models=["GLM", "XGB2", "XGB7"], show="resilience_distance",
                  resilience_method="worst-sample", metric="MAE", alpha=0.3, figsize=(5, 4))
Total running time of the script: ( 1 minutes 21.459 seconds)
Estimated memory usage: 81 MB