Note
Go to the end to download the full example code or to run this example in your browser via Binder
Data Dependent Explanation
Experiment initialization and data preparation
from piml import Experiment
from piml.models import XGB2Classifier

exp = Experiment()
exp.data_loader(data="SimuCredit", silent=True)
exp.data_summary(feature_exclude=["Gender", "Race"], silent=True)
exp.data_prepare(target="Approved", task_type="classification", silent=True)
Train Model
exp.model_train(model=XGB2Classifier(n_estimators=100), name="XGB2")
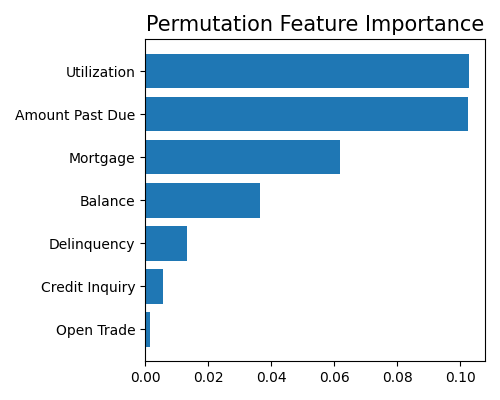
PFI with training data (by default)
exp.model_explain(model="XGB2", show="pfi", figsize=(5, 4))
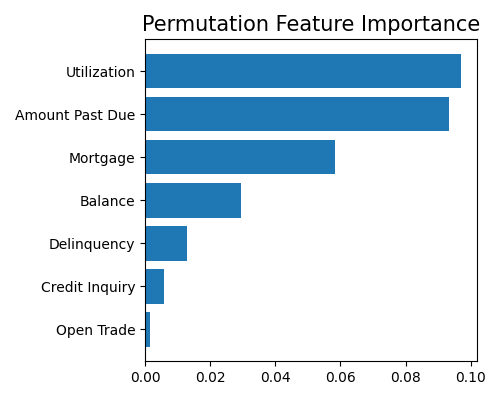
PFI with testing data
exp.model_explain(model="XGB2", show="pfi", use_test=True, figsize=(5, 4))
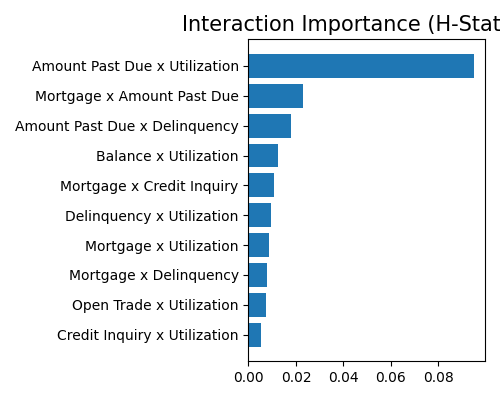
H-statistics with training data (use training data by default)
exp.model_explain(model="XGB2", show="hstats",
                  grid_size=5, figsize=(5, 4))

H-statistics with testing data
exp.model_explain(model="XGB2", show="hstats", use_test=True,
                  grid_size=5, figsize=(5, 4))
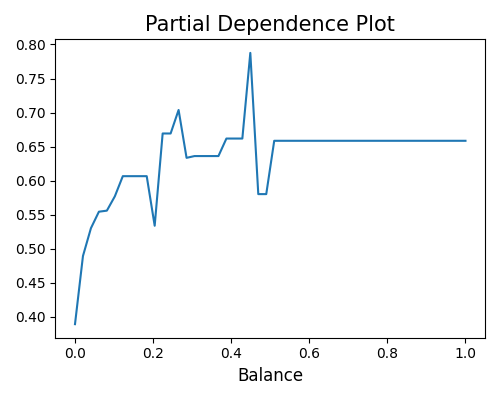
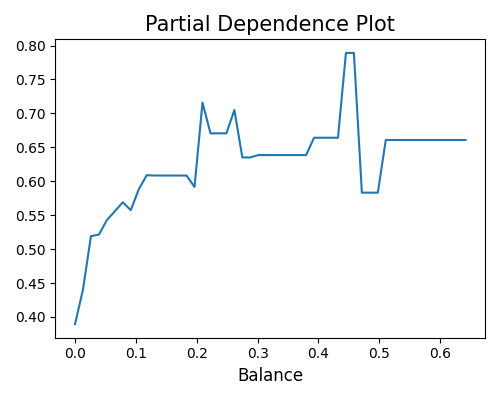
PDP with training data (use training data by default)
exp.model_explain(model="XGB2", show="pdp", uni_feature="Balance",
                  grid_size=50, figsize=(5, 4))
PDP with testing data
exp.model_explain(model="XGB2", show="pdp", uni_feature="Balance",
                  grid_size=50, use_test=True, figsize=(5, 4))
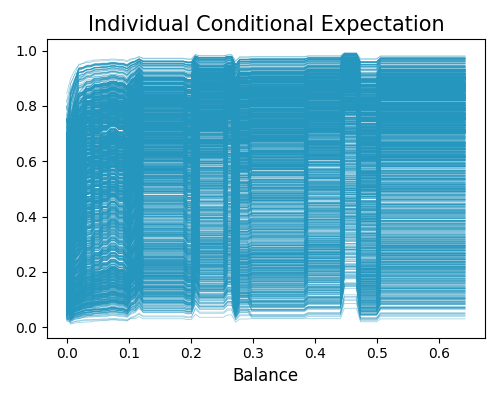
ICE with training data (use training data by default)
exp.model_explain(model="XGB2", show="ice", uni_feature="Balance",
                  figsize=(5, 4))
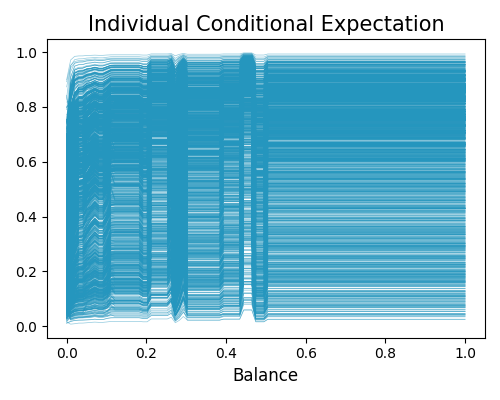
ICE with testing data
exp.model_explain(model="XGB2", show="ice", uni_feature="Balance",
                  use_test=True, figsize=(5, 4))
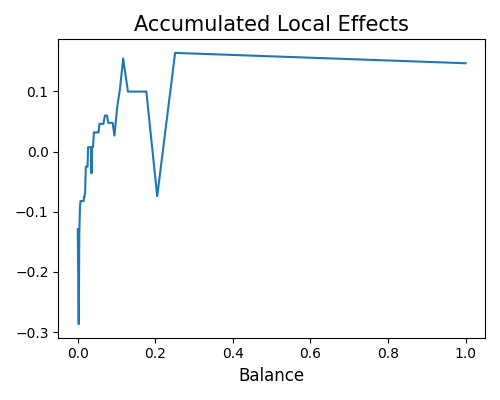
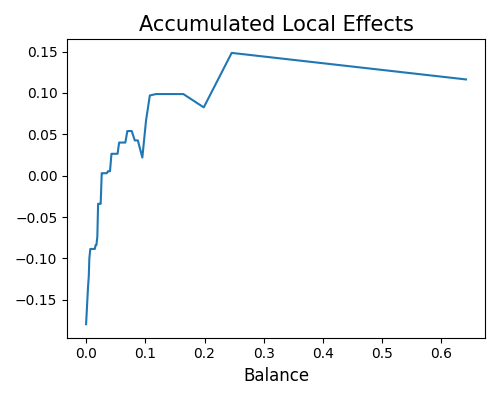
ALE with training data (use training data by default)
exp.model_explain(model="XGB2", show="ale", uni_feature="Balance",
                  grid_size=50, figsize=(5, 4))
ALE with testing data
exp.model_explain(model="XGB2", show="ale", uni_feature="Balance",
                  grid_size=50, use_test=True, figsize=(5, 4))
LIME on training data (use training data by default)
exp.model_explain(model="XGB2", show="lime", sample_id=0, figsize=(5, 4))
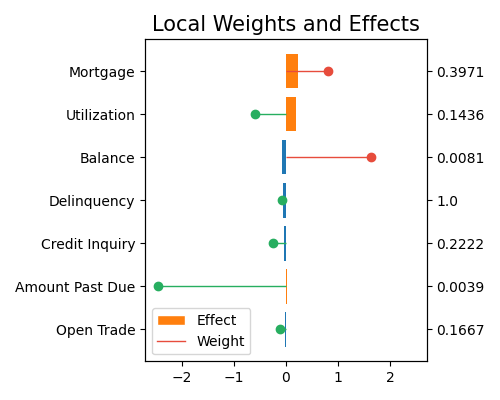
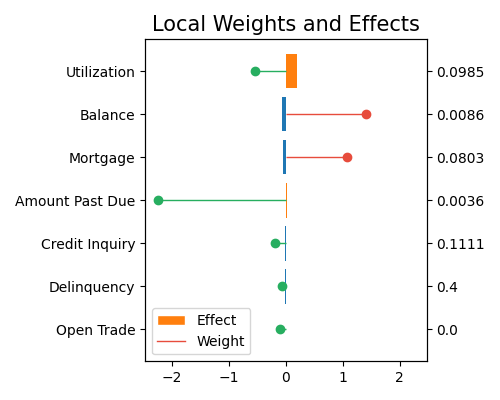
LIME on testing data
exp.model_explain(model="XGB2", show="lime", sample_id=0, use_test=True, figsize=(5, 4))
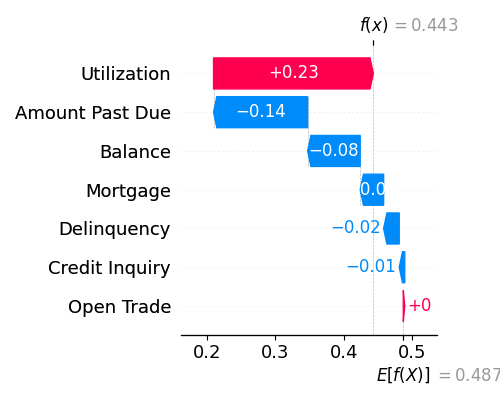
SHAP on training data (use training data by default)
exp.model_explain(model="XGB2", show="shap_waterfall", sample_id=0, figsize=(5, 4))
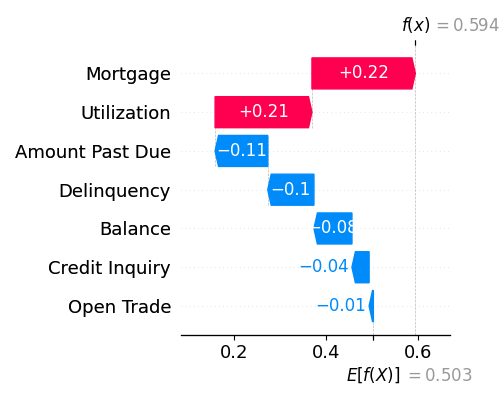
SHAP on testing data
exp.model_explain(model="XGB2", show="shap_waterfall", sample_id=0, use_test=True, figsize=(5, 4))
Total running time of the script: ( 1 minutes 50.451 seconds)
Estimated memory usage: 70 MB