Note
Go to the end to download the full example code or to run this example in your browser via Binder
XGB-1 Classification (CoCircles)
Experiment initialization and data preparation
from piml import Experiment
from piml.models import XGB1Classifier

exp = Experiment()
exp.data_loader(data="CoCircles", silent=True)
exp.data_prepare(target="target", task_type="classification", silent=True)
Train Model
exp.model_train(model=XGB1Classifier(n_estimators=100, max_bin=20, min_bin_size=0.01), name="XGB1")
Evaluate predictive performance
exp.model_diagnose(model="XGB1", show='accuracy_table')
           ACC      AUC       F1 LogLoss   Brier

Train   0.8512   0.9311   0.8499  0.3327  0.1052
Test    0.8450   0.9028   0.8368  0.4084  0.1214
Gap    -0.0062  -0.0283  -0.0131  0.0758  0.0162
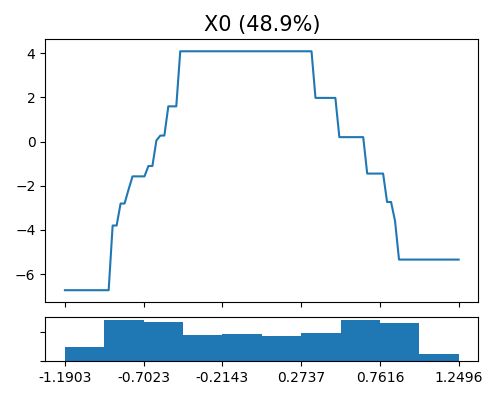
Global effect plot for X0
exp.model_interpret(model="XGB1", show="global_effect_plot", uni_feature="X0", original_scale=True, figsize=(5, 4))
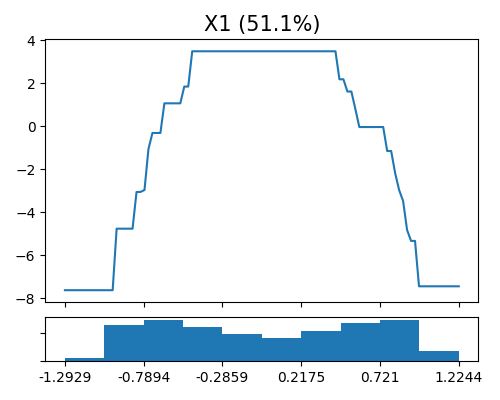
Global effect plot for X1
exp.model_interpret(model="XGB1", show="global_effect_plot", uni_feature="X1", original_scale=True, figsize=(5, 4))
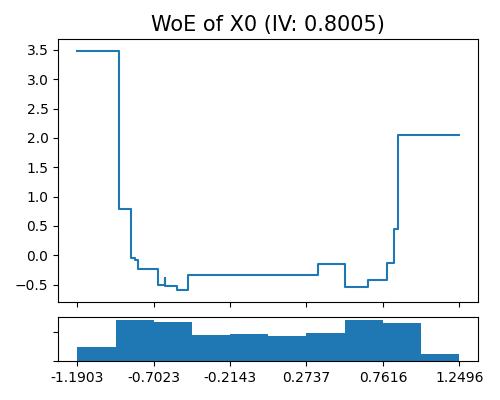
Weight of evidence plot for X0
exp.model_interpret(model="XGB1", show="xgb1_woe", uni_feature="X0", original_scale=True, figsize=(5, 4))
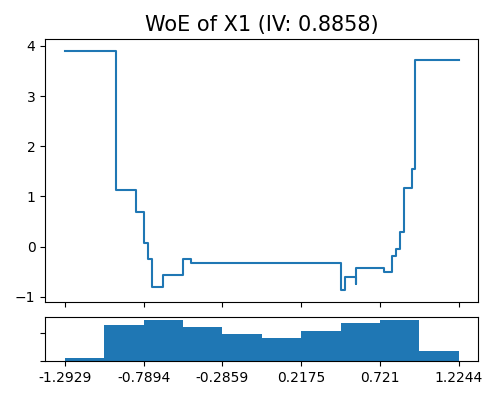
Weight of evidence plot for X1
exp.model_interpret(model="XGB1", show="xgb1_woe", uni_feature="X1", original_scale=True, figsize=(5, 4))
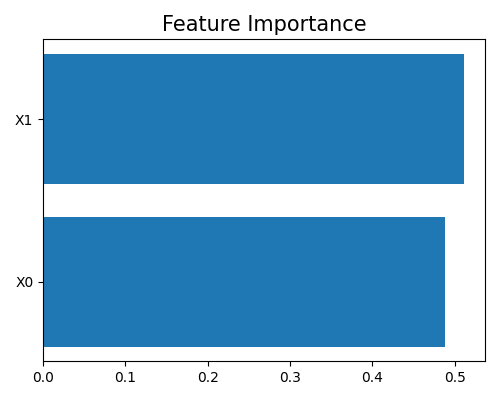
Feature importance
exp.model_interpret(model="XGB1", show="global_fi", figsize=(5, 4))
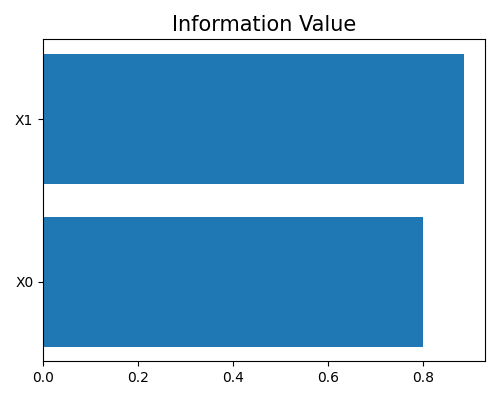
Information value plot
exp.model_interpret(model="XGB1", show="xgb1_iv", figsize=(5, 4))
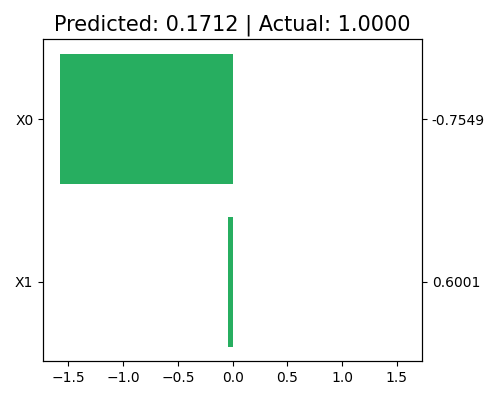
Local interpretation
exp.model_interpret(model="XGB1", show="local_fi", sample_id=0, original_scale=True, figsize=(5, 4))
Total running time of the script: ( 1 minutes 26.187 seconds)
Estimated memory usage: 17 MB
