Note
Go to the end to download the full example code or to run this example in your browser via Binder
XGB-1 Regression (California Housing)
Experiment initialization and data preparation
from piml import Experiment
from piml.models import XGB1Regressor

exp = Experiment()
exp.data_loader(data="CaliforniaHousing_trim2", silent=True)
exp.data_prepare(target="MedHouseVal", task_type="regression", silent=True)
Train model
exp.model_train(model=XGB1Regressor(n_estimators=500, max_bin=20, min_bin_size=0.01), name="XGB1")
Train model with monotonicity constrained on MedInc
exp.model_train(model=XGB1Regressor(n_estimators=500, max_bin=20, min_bin_size=0.01,
                                    mono_increasing_list=("MedInc", )),
                name="Mono-XGB1")
Evaluate predictive performance of XGB1
exp.model_diagnose(model="XGB1", show='accuracy_table')
          MSE     MAE       R2

Train  0.0131  0.0816   0.7704
Test   0.0136  0.0822   0.7546
Gap    0.0005  0.0006  -0.0159
Evaluate predictive performance of Mono-XGB1
exp.model_diagnose(model="Mono-XGB1", show='accuracy_table')
          MSE     MAE       R2

Train  0.0134  0.0831   0.7649
Test   0.0139  0.0837   0.7490
Gap    0.0005  0.0006  -0.0159
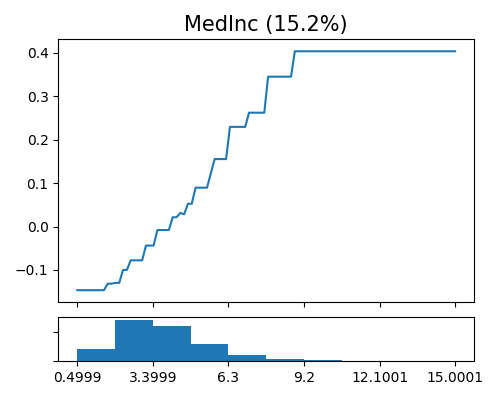
Global effect plot of XGB1 on MedInc
exp.model_interpret(model="XGB1", show="global_effect_plot", uni_feature="MedInc",
                    original_scale=True, figsize=(5, 4))
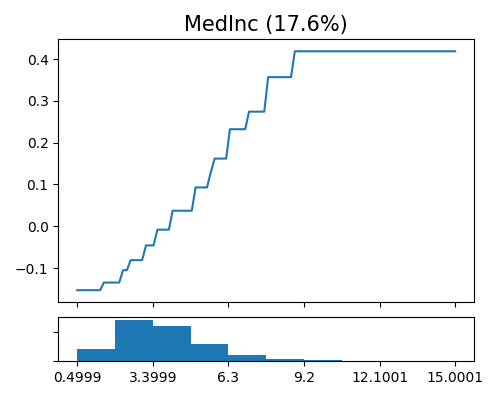
Global effect plot of Mono-XGB1 on MedInc
exp.model_interpret(model="Mono-XGB1", show="global_effect_plot", uni_feature="MedInc",
                    original_scale=True, figsize=(5, 4))
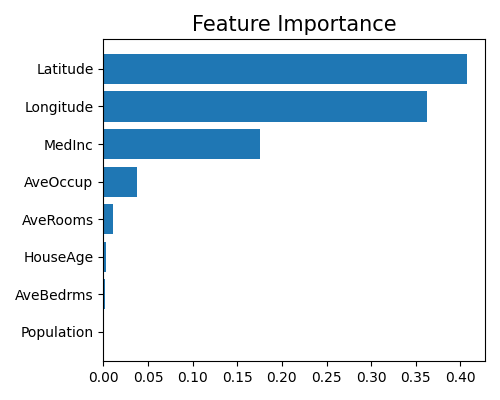
Feature importance of Mono-XGB1
exp.model_interpret(model="Mono-XGB1", show="global_fi", figsize=(5, 4))
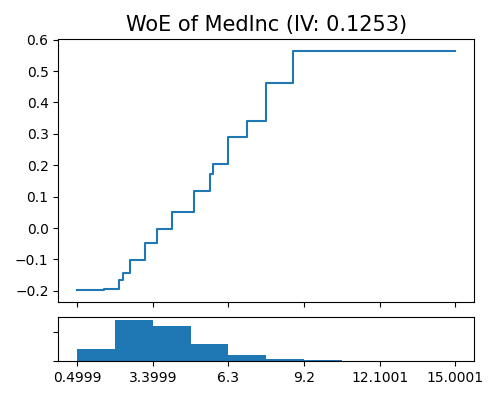
Weight of evidence plot of Mono-XGB1 on MedInc
exp.model_interpret(model="Mono-XGB1", show="xgb1_woe", uni_feature="MedInc", original_scale=True, figsize=(5, 4))
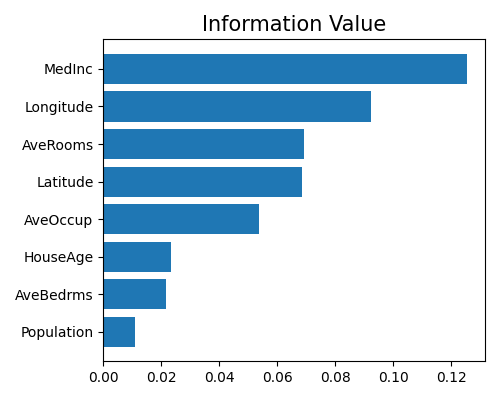
Information value plot of Mono-XGB1
exp.model_interpret(model="Mono-XGB1", show="xgb1_iv", figsize=(5, 4))
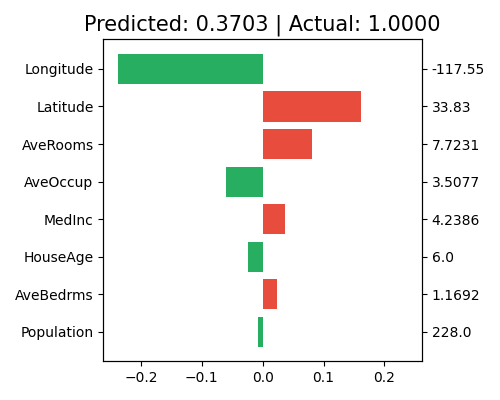
Local interpretation of Mono-XGB1
exp.model_interpret(model="Mono-XGB1", show="local_fi", sample_id=0, original_scale=True, figsize=(5, 4))
Total running time of the script: (0 minutes 8.159 seconds)