Note
Go to the end to download the full example code or to run this example in your browser via Binder
WeakSpot: Regression
Experiment initialization and data preparation
from piml import Experiment
from piml.models import XGB2Regressor

exp = Experiment()
exp.data_loader(data="BikeSharing", silent=True)
exp.data_summary(feature_exclude=["yr", "mnth", "temp"], silent=True)
exp.data_prepare(target="cnt", task_type="regression", silent=True)
Train Model
exp.model_train(model=XGB2Regressor(), name="XGB2")
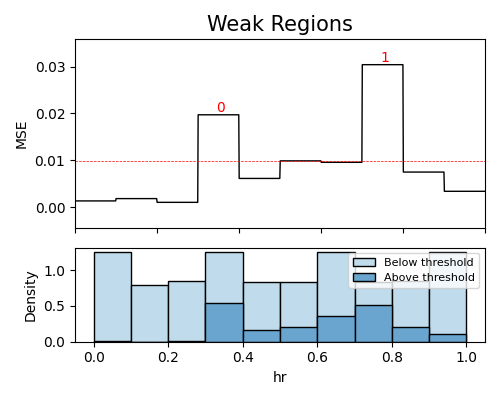
Histogram-based weakspot for a single feature
results = exp.model_diagnose(model="XGB2", show="weakspot", slice_method="histogram",
                             slice_features=["hr"], threshold=1.1, min_samples=100,
                             return_data=True, figsize=(5, 4))
results.data
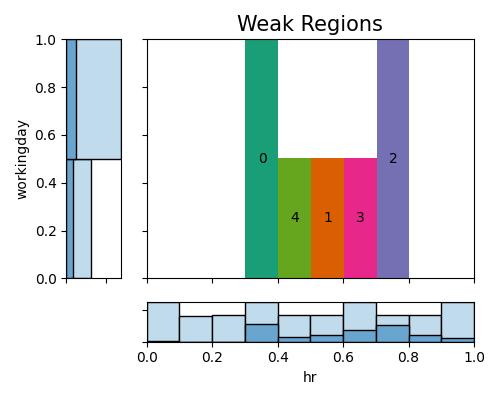
Histogram-based weakspot for two features
results = exp.model_diagnose(model="XGB2", show="weakspot", slice_method="histogram",
                             slice_features=["hr", "workingday"], threshold=1.1, min_samples=100,
                             return_data=True, figsize=(5, 4))
results.data
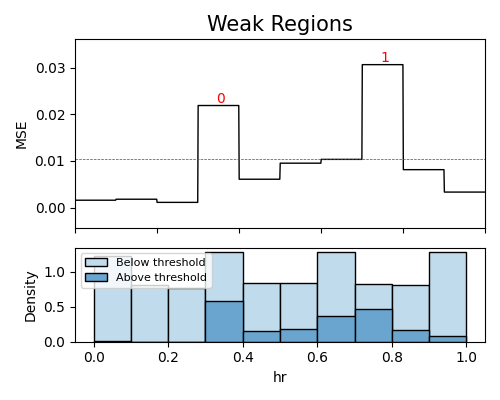
Histogram-based weakspot for a single feature on test set
results = exp.model_diagnose(model="XGB2", show="weakspot", slice_method="histogram",
                             slice_features=["hr"], threshold=1.1, min_samples=100,
                             use_test=True, return_data=True, figsize=(5, 4))
results.data
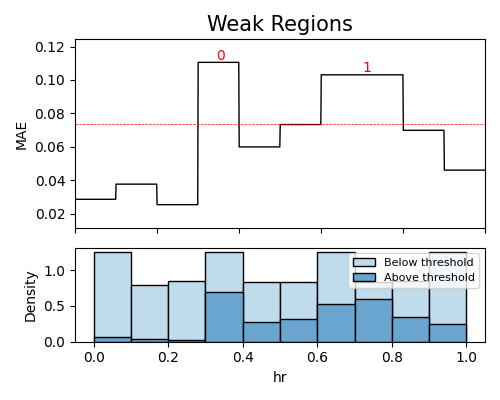
Histogram-based weakspot for a single feature using MAE metric
results = exp.model_diagnose(model="XGB2", show="weakspot", slice_method="histogram",
                             slice_features=["hr"], threshold=1.1, min_samples=100,
                             metric="MAE", return_data=True, figsize=(5, 4))
results.data
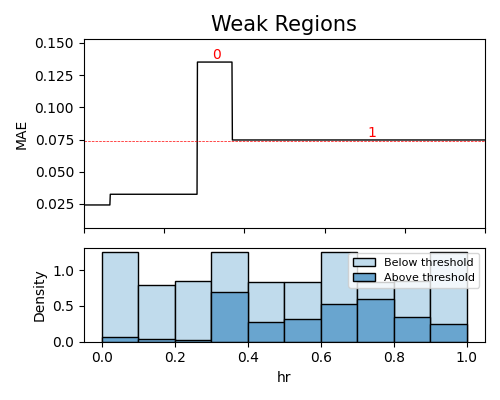
Tree-based weakspot for a single feature using MAE metric
results = exp.model_diagnose(model="XGB2", show="weakspot", slice_method="tree",
                             slice_features=["hr"], threshold=1.1, min_samples=100,
                             metric="MAE", return_data=True, figsize=(5, 4))
results.data
Total running time of the script: ( 0 minutes 56.209 seconds)
Estimated memory usage: 22 MB