Note
Go to the end to download the full example code or to run this example in your browser via Binder
Resilience: Classification
Experiment initialization and data preparation
from piml import Experiment
from piml.models import XGB2Classifier

exp = Experiment()
exp.data_loader(data="TaiwanCredit", silent=True)
exp.data_summary(feature_exclude=["LIMIT_BAL", "SEX", "EDUCATION", "MARRIAGE", "AGE"], silent=True)
exp.data_prepare(target="FlagDefault", task_type="classification", silent=True)
Train Model
exp.model_train(model=XGB2Classifier(max_depth=2, n_estimators=100), name="XGB2")
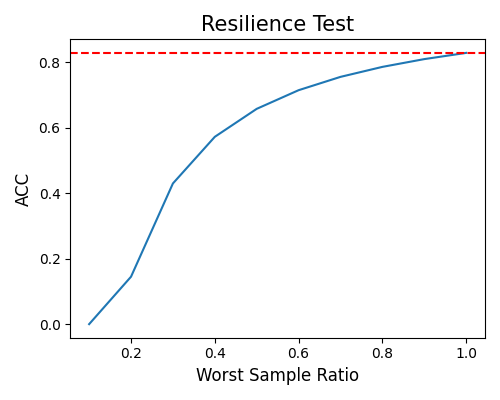
Resilience performance against worst sample scenario
exp.model_diagnose(model="XGB2", show="resilience_perf", resilience_method="worst-sample", figsize=(5, 4))
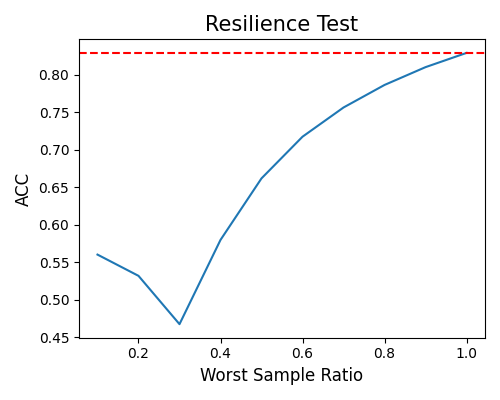
Resilience performance against hard sample scenario
exp.model_diagnose(model="XGB2", show="resilience_perf", resilience_method="hard-sample", figsize=(5, 4))
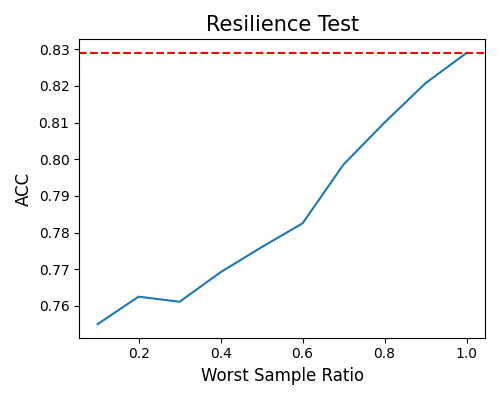
Resilience performance against outer sample scenario
exp.model_diagnose(model="XGB2", show="resilience_perf", resilience_method="outer-sample", figsize=(5, 4))
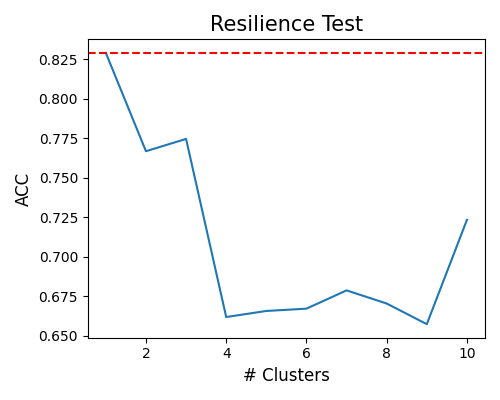
Resilience performance against worst cluster scenario
exp.model_diagnose(model="XGB2", show="resilience_perf", resilience_method="worst-cluster", figsize=(5, 4))
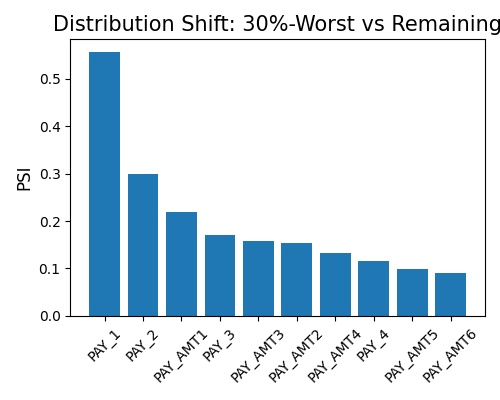
Marginal distributional distance between full sample and worst sample
exp.model_diagnose(model="XGB2", show="resilience_distance", resilience_method="worst-sample",
                   distance_metric="PSI", alpha=0.3, figsize=(5, 4))
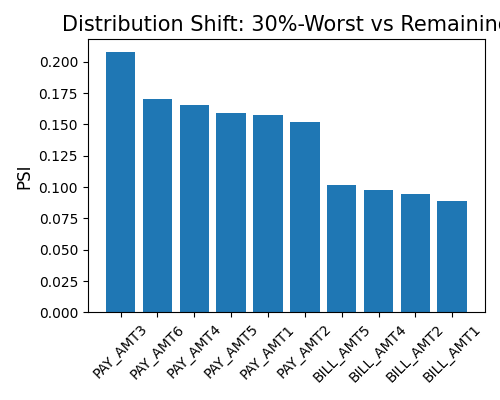
Marginal distributional distance between full sample and worst sample with not Non-immutable features
exp.model_diagnose(model="XGB2", show="resilience_distance", resilience_method="worst-sample",
                         distance_metric="PSI", immu_feature="PAY_1", alpha=0.3, figsize=(5, 4))
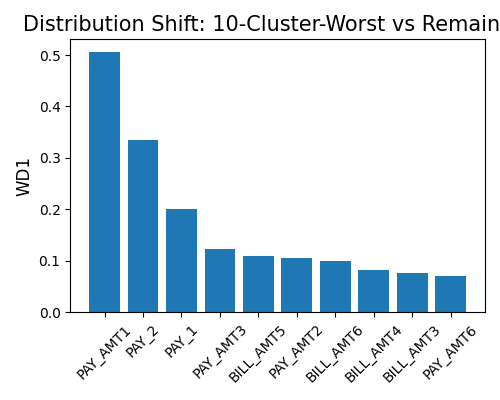
Marginal distributional distance between full sample and worst sample with worst-cluster scenario
exp.model_diagnose(model="XGB2", show="resilience_distance", resilience_method="worst-cluster",
                   distance_metric="WD1", n_clusters=10, figsize=(5, 4))
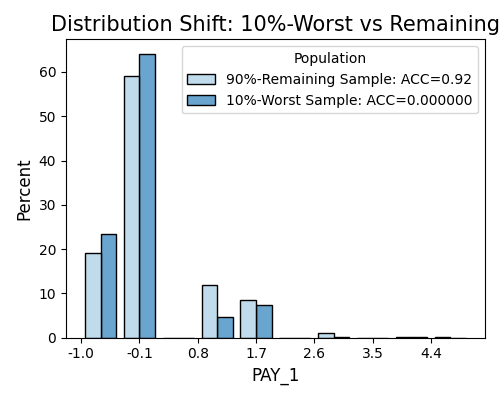
Marginal histogram plot for full sample and worst sample
exp.model_diagnose(model="XGB2", show="resilience_shift_histogram", resilience_method="worst-sample",
                   show_feature="PAY_1", original_scale=True, figsize=(5, 4))
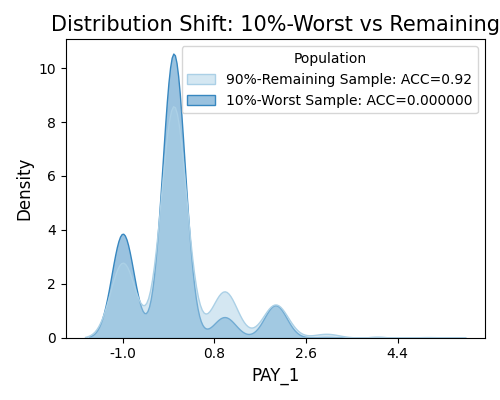
Marginal density plot for full sample and worst sample
exp.model_diagnose(model="XGB2", show="resilience_shift_density", resilience_method="worst-sample",
                   show_feature="PAY_1", original_scale=True, figsize=(5, 4))
Total running time of the script: ( 1 minutes 41.200 seconds)
Estimated memory usage: 56 MB