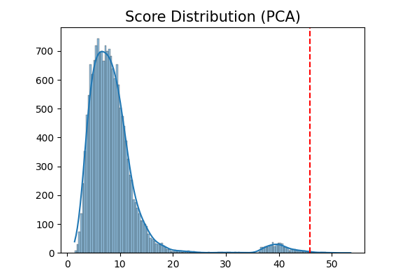
piml.data.outlier_detection.PCA
- class piml.data.outlier_detection.PCA(n_components=None, n_selected_components=None, cumulative_variance=None, score_type='mahalanobis', d_reduction_method='pca', copy=True, whiten=False, svd_solver='auto', tol=0.0, iterated_power='auto', alpha=0.1, random_state=0, standardization=True)
A wrapper of sklearn’s PCA for outlier detection.
- Parameters:
- n_componentsint, float, None or string
Number of components to keep. if n_components is not set all components are kept:
n_components == min(n_samples, n_features)
if n_components == ‘mle’ and svd_solver == ‘full’, Minka’s MLE is used to guess the dimension if
0 < n_components < 1and svd_solver == ‘full’, select the number of components such that the amount of variance that needs to be explained is greater than the percentage specified by n_components n_components cannot be equal to n_features for svd_solver == ‘arpack’.- n_selected_componentsint, default=None
Number of selected principal components. Only used as cumulative_variance is not None, otherwise, n_selected_components will be automated overwritten by this cumulative_variance. If None, will use all principal components.
- cumulative_variancefloat, default=None
The cumulative variance limit (between 0.0 and 1.0) of the top principal components.
- copybool, default=True
If False, data passed to fit are overwritten and running fit(X).transform(X) will not yield the expected results, use fit_transform(X) instead.
- whitenbool, default=False
When True (False by default) the
components_vectors are multiplied by the square root of n_samples and then divided by the singular values to ensure uncorrelated outputs with unit component-wise variances.Whitening will remove some information from the transformed signal (the relative variance scales of the components) but can sometime improve the predictive accuracy of the downstream estimators by making their data respect some hard-wired assumptions.
- svd_solver{‘auto’, ‘full’, ‘arpack’, ‘randomized’}, default=’auto’
- auto :
the solver is selected by a default policy based on
X.shapeandn_components: if the input data is larger than 500x500 and the number of components to extract is lower than 80% of the smallest dimension of the data, then the more efficient ‘randomized’ method is enabled. Otherwise the exact full SVD is computed and optionally truncated afterwards.- full :
run exact full SVD calling the standard LAPACK solver via
scipy.linalg.svdand select the components by postprocessing- arpack :
run SVD truncated to n_components calling ARPACK solver via
scipy.sparse.linalg.svds. It requires strictly 0 < n_components < X.shape[1]- randomized :
run randomized SVD by the method of Halko et al.
- tolfloat, default=.0
Tolerance for singular values computed by svd_solver == ‘arpack’.
- iterated_powerint, default=’auto’
Number of iterations for the power method computed by svd_solver == ‘randomized’.
- alpha: float, default=1
Sparsity controlling parameter. Higher values lead to sparser components.
- random_stateint, default=0
The random seed.
- standardizationbool, default=True
If True, perform standardization first to convert data to zero mean and unit variance. See http://scikit-learn.org/stable/auto_examples/preprocessing/plot_scaling_importance.html
Methods
decision_function(X[, scale])Predict raw outliers score of X using the fitted detector.
fit(X[, y])Fit the model.
predict([X, scale, threshold])Predict raw outlier indicator.
- decision_function(X, scale=True)
- Predict raw outliers score of X using the fitted detector.
For consistency, outliers are assigned with larger anomaly scores.
- Parameters:
- Xnumpy array of shape (n_samples, n_features)
The training input samples. Sparse matrices are accepted only if they are supported by the base estimator.
- scalebool, default=True
If True, scale X before calculating the outlier score.
- Returns:
- outlier_scoresnumpy array of shape (n_samples,)
The anomaly score of the input samples.
- fit(X, y=None)
Fit the model.
- Parameters:
- Xnp.ndarray of shape (n_samples, n_features)
Data features.
- ynp.ndarray of shape (n_samples,), default=None
Data response.
- predict(X=None, scale=True, threshold=0.9)
Predict raw outlier indicator.
Normal samples are classified as 1 and outliers are classified as -1.
- Parameters:
- Xnumpy array of shape (n_samples, n_features)
The training input samples. Sparse matrices are accepted only if they are supported by the base estimator.
- scalebool, default=True
If True, scale X before calculating the outlier score.
- thresholdfloat, default=0.9
The quantile threshold of outliers. For example, the samples with outlier scores greater than 90% quantile of the whole sample will be classified as outliers.
- Returns:
- outlier_indicatornumpy array of shape (n_samples,)
The binary array indicating whether each sample is outlier.

