7.3. Fairness Comparison
This section is dedicated to evaluating and comparing the bias and fairness of models, using the function exp.model_fairness_compare. The “SimuCredit” dataset is utilized, and the results are demonstrated using two models: GLMClassifier (GLM) and ExplainableBoostingClassifier (EBM). The performance of the EBM model is superior to that of GLM since the former is a more intricate machine-learning model. However, when considering fairness comparison, we will observe a distinct perspective.
7.3.1. Fairness Metrics
In the following comparison, we assess the fairness of EBM in comparison to GLM, focusing on two distinct demographic attributes: Race and Gender. It is important to note that these attributes cannot be directly utilized in the model. Consequently, any observed unfairness is likely attributed to the influence of other variables that are associated with these two attributes.
metrics_result = exp.model_fairness_compare(models=["GLM", "EBM"], show="metrics", metric="AIR",
                                            group_category=["Race", "Gender"],
                                            reference_group=[1., 1.], protected_group=[0., 0.],
                                            favorable_threshold=0.5,
                                            figsize=(6, 4), return_data=True)

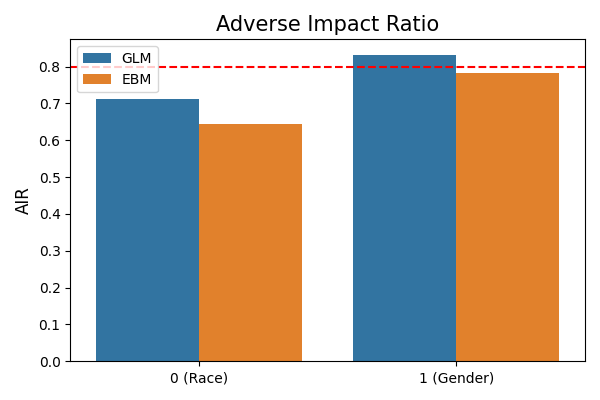
The displayed plot depicts the AIR (Adverse Impact Ratio) comparisons for these two demographic attributes. The left bar plot represents the AIRs for the Race attribute, specifically comparing 1 (reference group) against 0 (protected group). Conversely, the right bar plot demonstrates the AIRs for the Gender attribute, comparing 1 (reference group) to 0 (protected group). The y-axis of the plot represents the AIR values, where a value of 1 signifies no discrimination. In practical terms, any AIR value below 0.8 is considered indicative of discrimination. In the provided figure, the AIR values for protected groups are both lower than 1, implying that discrimination is present. Notably, the AIR values for the EBM model are lower than those for the GLM model, indicating a higher level of discrimination in the former.
7.3.2. Segmented
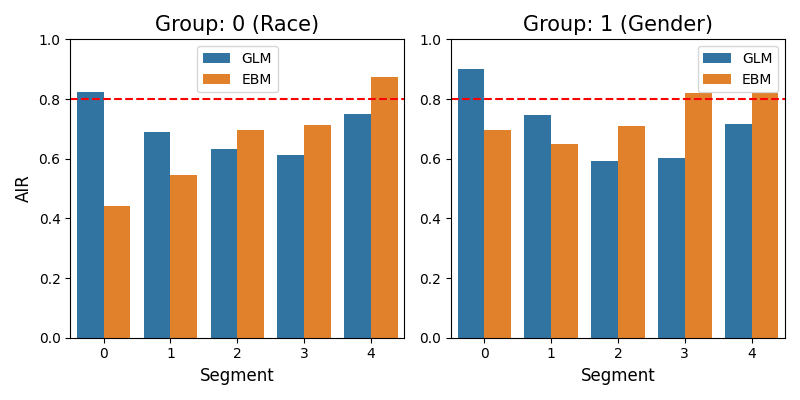
In addition to the overall comparison based on the entire dataset, it is also possible to compare the models within appropriately segmented subsets of the dataset. The following results offer comparisons within segments of the predictor variable Balance.
segmented_result = exp.model_fairness_compare(models=["GLM", "EBM"], show="segmented", metric="AIR",
                                              segment_feature="Balance",
                                              group_category=["Race", "Gender"],
                                              reference_group=[1., 1.], protected_group=[0., 0.],
                                              segment_bins=5, favorable_threshold=0.5,
                                              return_data=True, figsize=(8, 4))

From the plots, we can see the AIR values of the two models are very different for different segments of Balance.
7.3.3. Examples
The full example codes of this section can be found in the following link.
