4.1. PFI (Permutation Feature Importance)
The permutation feature importance (PFI) measures the influence of individual features on the model by calculating the increase in loss \(L\) when the feature set, typically one feature, is permuted [L2001]. When a feature value is randomly shuffled, the relationship between the feature and the target is broken, and the resulting drop in model performance indicates the feature’s significance. PFI can be used to assess the model’s reliance on each feature in the input set. However, it should be noted that different models can have very different feature importance rankings, the PFI results can only reveal the importance of each feature to that specific model.
4.1.1. Algorithm Details
Assuming we have a fully trained model, denoted by \(f(x)\), and a dataset either training or testing data. For the time being, PiML only uses training data for the PFI calculation, and more flexible options will be provided in the future release.
First of all, we evaluate the performance of the model and the data and record the resulting performance score. Next, for each feature \(k\), do the following:
Randomly shuffle the values of feature \(k\) in the original dataset, while the rest feature values keep unchanged. By doing so, we generate a shuffled dataset.
Evaluate the model performance on the shuffled dataset, and record the resulting performance score.
Compute the performance degradation, and this is viewed as the importance of feature \(k\).
Finally, as the above steps involve some randomness, we usually repeat these steps for some iterations and calculate the average.
The larger the average performance degradation, the more important the feature is considered to be. Note that the performance degradation may be negative, which means that the model achieves better performance as that feature is removed. In this case, we truncate the negative importance to zero. In PiML, the above calculations are based on the permutation_importance function of scikit-learn. For regression tasks, the performance metric is set to MSE; and for binary classification, the AUC metric is used. For more analysis of this algorithm, please refer to the documentation here.
4.1.2. Usage
As the data and model are already prepared in PiML, we can directly use the model_explain function to show the PFI plot. Note that this function is the one-site API for all the post-hoc explainability methods. For PFI, we can specify the explainability method by setting the parameter show to “pfi”.
n_repeats: The number of permutation repetitions, by default 1.use_test: If True, the test data will be used to generate the explanations. Otherwise, the training data will be used. The default value is False.
The example below demonstrates how to use PiML with its high-code APIs to develop machine learning models for the BikeSharing data.
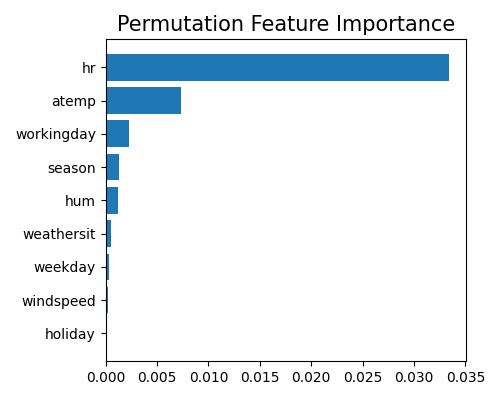
exp.model_explain(model="XGB2", show="pfi", n_repeats=10, figsize=(5, 4))

This analysis gives us valuable insights into how our model makes predictions. We see that the variable hr is the most important feature. atemp and workingday also appear to be important predictors. The variable holiday seems to have zero contribution to the model. This is not surprising, as the dataset does not contain any holiday data.
